Damage Caused by Classification Accuracy and Other Discontinuous Improper Accuracy Scoring Rules
I have discussed the many advantages of probability estimation over classification. Here I discuss a particular problem related to classification, namely the harm done by using discontinuous accuracy scoring rules. Accuracy scores are used to drive feature selection, parameter estimation, and for measuring predictive performance on models derived using any optimization algorithm. For this discussion let Y denote a no/yes false/true 0/1 event being predicted, and let Y=0 denote a non-event and Y=1 the event occurred.
As discussed here and here, a proper accuracy scoring rule is a metric applied to probability forecasts. It is a metric that is optimized when the forecasted probabilities are identical to the true outcome probabilities. A continuous accuracy scoring rule is a metric that makes full use of the entire range of predicted probabilities and does not have a large jump because of an infinitesimal change in a predicted probability. The two most commonly used proper scoring rules are the quadratic error measure, i.e., mean squared error or Brier score, and the logarithmic scoring rule, which is a linear translation of the log likelihood for a binary outcome model (Bernoulli trials). The logarithmic rule gives more credit to extreme predictions that are “right”, but a single prediction of 1.0 when Y=0 or 0.0 when Y=1 will result in infinity no matter how accurate were all the other predictions. Because of the optimality properties of maximum likelihood estimation, the logarithmic scoring rule is in a sense the gold standard, but we more commonly use the Brier score because of its easier interpretation and its ready decomposition into various metrics measuring calibration-in-the-small, calibration-in-the-large, and discrimination.
Classification accuracy is a discontinuous scoring rule. It implicitly or explicitly uses thresholds for probabilities, and moving a prediction from 0.0001 below the threshold to 0.0001 above the thresholds results in a full accuracy change of 1/N. Classification accuracy is also not a strictly proper scoring rule. It can be optimized by choosing the wrong predictive features and giving them the wrong weights. This is best shown by a simple example that appears in Biostatistics for Biomedical Research Chapter 18 in which 400 simulated subjects have an overall fraction of Y=1 of 0.57. Consider the use of binary logistic regression to predict the probability that Y=1 given a certain set of covariates, and classify a subject as having Y=1 if the predicted probability exceeds 0.5. We simulate values of age and sex and simulate binary values of Y according to a logistic model with strong age and sex effects; the true log odds of Y=1 are (age-50).04 + .75(sex=m). We fit four binary logistic models in order: a model containing only age as a predictor, one containing only sex, one containing both age and sex, and a model containing no predictors (i.e., it only has an intercept parameter). The results are in the following table:
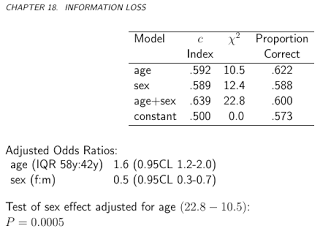
Both the gold standard likelihood ratio chi-square statistic and the improper pure discrimination c-index (AUROC) indicate that both age and sex are important predictors of Y. Yet the highest proportion correct (classification accuracy) occurs when sex is ignored. According to the improper score, the sex variable has negative information. It is telling that a model that predicted Y=1 for every observation, i.e., one that completely ignored age and sex and only has the intercept in the model, would be 0.573 accurate, only slightly below the accuracy of using sex alone to predict Y.
The use of a discontinuous accuracy score such as proportion “classified” “correctly” has led to countless misleading findings in bioinformatics, machine learning, and data science. In some extreme cases the machine learning expert failed to note that their claimed predictive accuracy was less than that achieved by ignoring the data, e.g., by just predicting Y=1 when the observed prevalence of Y=1 was 0.98 whereas their extensive data analysis yielded an accuracy of 0.97. As discusssed here, fans of “classifiers” sometimes subsample from observations in the most frequent outcome category (here Y=1) to get an artificial 50/50 balance of Y=0 and Y=1 when developing their classifier. Fans of such deficient notions of accuracy fail to realize that their classifier will not apply to a population when a much different prevalence of Y=1 than 0.5.
Sensitivity and specificity are one-sided or conditional versions of classification accuracy. As such they are also discontinuous accuracy scores, and optimizing them will result in the wrong model. Regression Modeling Strategies Chapter 10 goes into more problems with classification accuracy, and discusses many measures of the quality of probability estimates. The text contains suggested measures to emphasize such as Brier score, pseudo R-squared (a simple function of the logarithmic scoring rule), c-index, and especially smooth nonparametric calibration plots to demonstrate absolute accuracy of estimated probabilities.
An excellent discussion with more information may be found here.
The video of a lecture on medical diagnosis and problems with sensitivity and specificity may be found here.
Other Resources
- Evaluating probabilistic forecasts with
scoringRulesby Alexander Jordan, Fabian Krüger, and Sebastian Lerch - The harm of class imbalance corrections for risk prediction models: illustration and simulation using logistic regression by van den Goorbergh, van Smeden, Timmerman, Van Calster