---
title: Implementation of the PATH Statement
author:
- name: Ewout Steyerberg
affiliation: Department of Biomedical Data Sciences<br>Leiden University Medical Center NL<br>`@ESteyerberg`
url: https://scholar.google.com/citations?user=_75LDyMAAAAJ&hl=nl
email: e.w.steyerberg@lumc.nl
date: 2020-11-24
contents: [RCT, drug-evaluation, generalizability, medicine, personalized-medicine, prediction, subgroup, 2020]
description: 'The recent PATH (Predictive Approaches to Treatment effect Heterogeneity) Statement outlines principles, criteria, and key considerations for applying predictive approaches to clinical trials to provide patient-centered evidence in support of decision making. Here challenges in implementing the PATH Statement are addressed with the GUSTO-I trial as a case study.'
---
```{r setup, include=FALSE}
require(rms)
require(table1)
require(DescTools)
require(metafor)
require(knitr)
require(kableExtra)
options(digits=3)
mu <- markupSpecs$html # in Hmisc
```
::: {.quoteit}
Evidence is derived from groups while most medical decisions are made for individual patients. — Kent _et al_, PATH statement
:::
Heterogeneity of treatment effect (**_HTE_**) refers to the nonrandom variation in the magnitude of the absolute treatment effect (**_treatment benefit_**) across individual patients. The recent **_[PATH](https://www.ncbi.nlm.nih.gov/pubmed/31711134)_** (Predictive Approaches to Treatment effect Heterogeneity) Statement outlines principles, criteria, and key considerations for applying predictive approaches to clinical trials to provide patient-centered evidence in support of decision making. The focus of PATH is on modeling of **_HTE_** across individual patients. [[Comments](https://hbiostat.org/comment.html)]{.aside}
The PATH statement lists a number of principles and guidelines. A first principle is to establish **_overall treatment effect_**. In another [blog](../covadj), I summarized the arguments in favor of covariate adjustment as the primary analysis of a RCT. Illustration was in the GUSTO-I trial. Here I continue that illustration, also following the blog by **Frank Harrell** on **_[examining HTE](../varyor)_**.
## Illustration in the GUSTO-I trial
Let's analyze the data from 30,510 patients with an acute myocardial infarction as included in the GUSTO-I trial. In GUSTO-I, 10,348 patients were randomized to receive tissue plasminogen activator (tPA), while 20,162 were randomzied to Streptokinase (SK) and had 30-day mortality status known.
```{r IDA.gusto}
load(url('http://hbiostat.org/data/repo/gusto.rda'))
# keep only SK and tPA arms; and selected set of covariates
gusto <- upData(gusto[gusto$tx=="SK" | gusto$tx=="tPA",],
                keep=Cs(day30, tx, age, Killip, sysbp, pulse, pmi, miloc, sex),
                                print=FALSE)
html(describe(gusto), scroll=TRUE)
```
### Overall treatment effect
The primary outcome was 30-day mortality. Among the tPA group, the 30-day mortality was 653/10,348 = 6.3% vs 1475/20,162 = 7.3% in the SK group. This an absolute difference of 1.0%, or an odds ratio of 0.85 [0.78-0.94].
```{r overall.tx}
# simple cross-table
table1(~ as.factor(day30) | tx, data=gusto, digits=2)
# 'tpa' as 0/1 variable for tPA vs SK treatment
gusto$tx <- droplevels(gusto$tx) # Drop the SK + tPA category which has 0 obs
gusto$tpa <- as.numeric(gusto$tx) - 1 # 0/1 coding for tPA treatment
label(gusto$tpa) <- "tPA"
levels(gusto$tpa) <- c("SK", "tPA")
tab2 <- table(gusto$day30, gusto$tpa)
result <- OddsRatio(tab2, conf.level = 0.95)
names(result) <- c("Odds Ratio", "Lower CI", "Upper CI")

kable(as.data.frame(t(result))) %>% kable_styling(full_width=F, position = "left")
# BinomDiffCI(x1 = events1, n1 = n1, x2 = events2, n2 = n2, ...)
CI      <- BinomDiffCI(x1 = tab2[2,1], n1 = sum(tab2[,1]), x2 = tab2[2,2], n2 = sum(tab2[,2]),
                       method = "scorecc")
colnames(CI) <- c("Absolute difference", "Lower CI", "Upper CI")

result <- round(CI, 3) # absolute difference with confidence interval
kable(as.data.frame(result)) %>% kable_styling(full_width=F, position = "left")
```
***
### Adjustment for baseline covariates
The unadjusted odds ratio of `r round(OddsRatio(tab2, conf.level = 0.95)[1], 3)` is a marginal estimate. As explained in the other blog, a lot can be said in favor of *conditional estimates*, where we adjust for prognostically important baseline characteristics. In line with [Califf 1997](https://www.sciencedirect.com/science/article/pii/S0002870397701649) and [Steyerberg 2000](https://www.sciencedirect.com/science/article/pii/S0002870300900012), we consider a prediction model with 6 baseline covariates, including age and Killip class (a measure for ventricular function). Pulse rate is modeled using a linear spline with a knot at 50 beats/minute.
```{r adjusted.tx}
options(prType='html')
f <- lrm(day30 ~ tpa + age + Killip + pmin(sysbp, 120) + lsp(pulse, 50) + pmi + miloc, data=gusto, x=T, maxit=99)
print(f) # coef tPA: -0.2080
```
So, we note that the **adjusted** regression coefficient for tPA was `r round(f$coef[2],4)`. The adjusted OR = `r round(exp(f$coef[2]),3)`.
Let's check for statistical interaction with
1. Individual covariates
2. The linear predictor
```{r interaction.tx}
## check for interaction
# 1. traditional approach
g <- lrm(day30 ~  tx * (age + Killip + pmin(sysbp, 120) + lsp(pulse, 50) + pmi + miloc),
          data=gusto, maxit=100)
print(anova(g)) # tx interactions: 10 df, p=0.5720; based on LR test
# 2. PATH statement: linear interaction with linear predictor; baseline risk, so tx=ref, SK
lp.no.tx <- f$coefficients[1] + 0 * f$coefficients[2] + f$x[,-1] %*% f$coefficients[-(1:2)]
gusto$lp <- as.vector(lp.no.tx) # add lp to data frame
h <- lrm(day30 ~ tx * lp, data=gusto)
print(anova(h)) # tx interaction: 1 df, p=0.35; based on Wald statistics
```
So:
1. The overall test for interaction with the individual covariates is far from statistically significant (p>0.5).
2. Similarly, the test for interaction with the linear predictor is far from statistically significant (p>0.3).
#### Conclusion: no interaction needed
We conclude that we may proceed by ignoring any interactions. We have no evidence against the assumption that the overall effect of treatment is applicable to all patients.
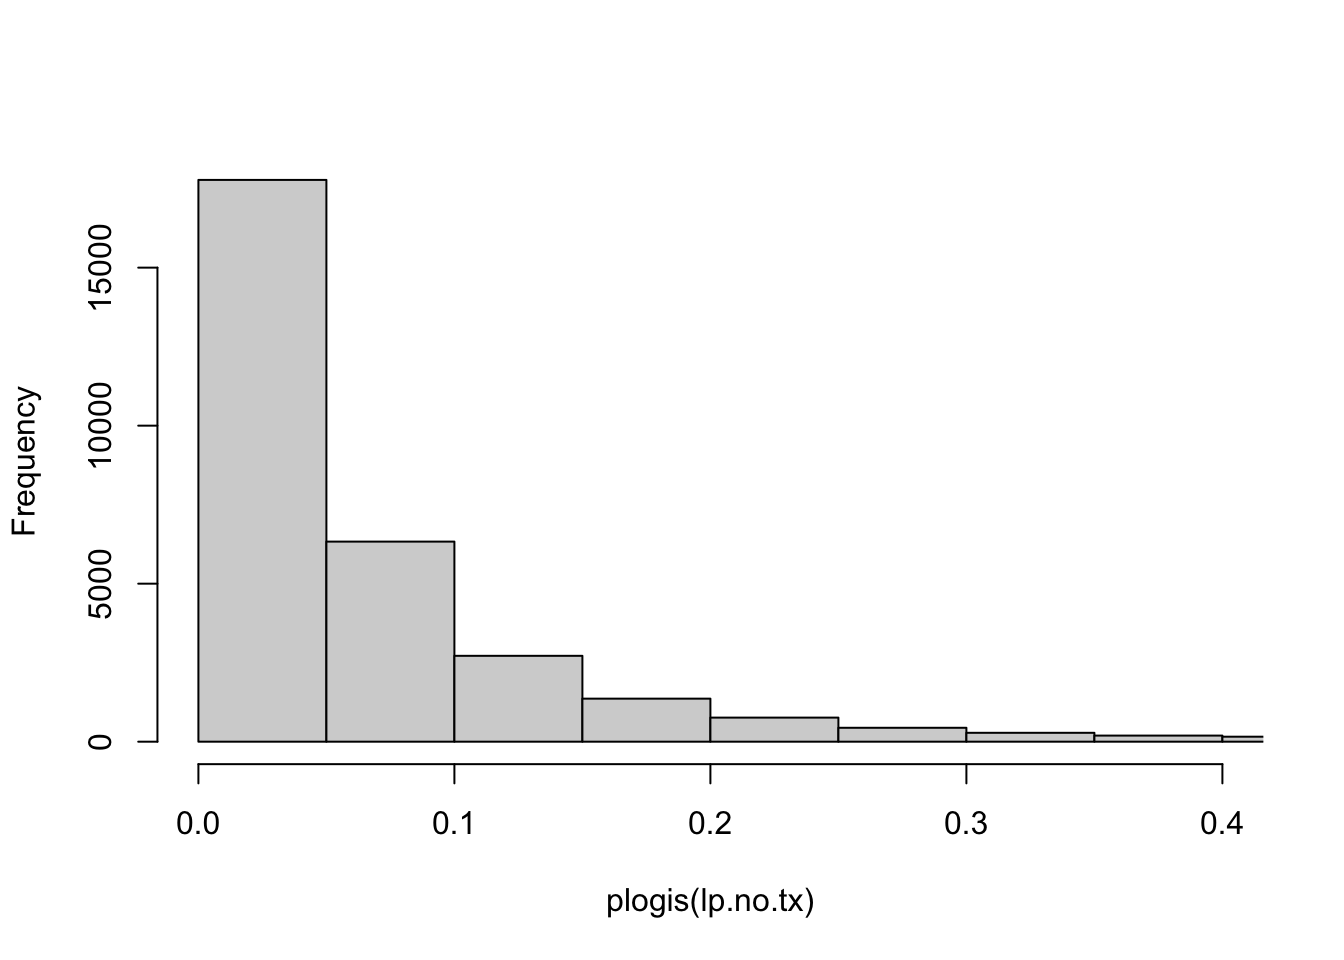
The patients vary widely in risk, as can easily be seen in the histogram below.
```{r histogram.lp}
hist(plogis(lp.no.tx), xlim=c(0,.4), main="")
```
We note that many patients have baseline risks (tPA==0) below 5%. Obviously their maximum benefit is bounded by this risk estimate, even if tPA, hypothetically, would reduce the risk to Null.
## PATH principle: perform risk-based subgrouping
**_[Fig 3](https://www.ncbi.nlm.nih.gov/pubmed/31711134)_** of the PATH Statement starts with:
::: {.quoteit}
Reporting RCT results stratified by a risk model is encouraged when overall trial results are positive to better understand the distribution of effects across the trial population.
:::
How do we provide such reporting of RCT results?
We can provide estimates of relative effects and absolute benefit
1. By group (e.g. quarters defined by quartiles)
2. By baseline risk (continuous, as in the histogram above)
### 1a. Relative effects of treatment by risk-group
The checks for interaction were far from statistically significant in GUSTO-I. We can further illustrate the relative effects in a forest plot.
Many reports from RCTs include forest plots that show relative effects by single variables, such as men vs women; young vs old age; disease subtype; etc.
The *PATH* statement encourages reporting by risk-based subgroup. How can such reporting be done?
Let's do some data processing to make a better forest plot.
#### A PATH compatible forest plot
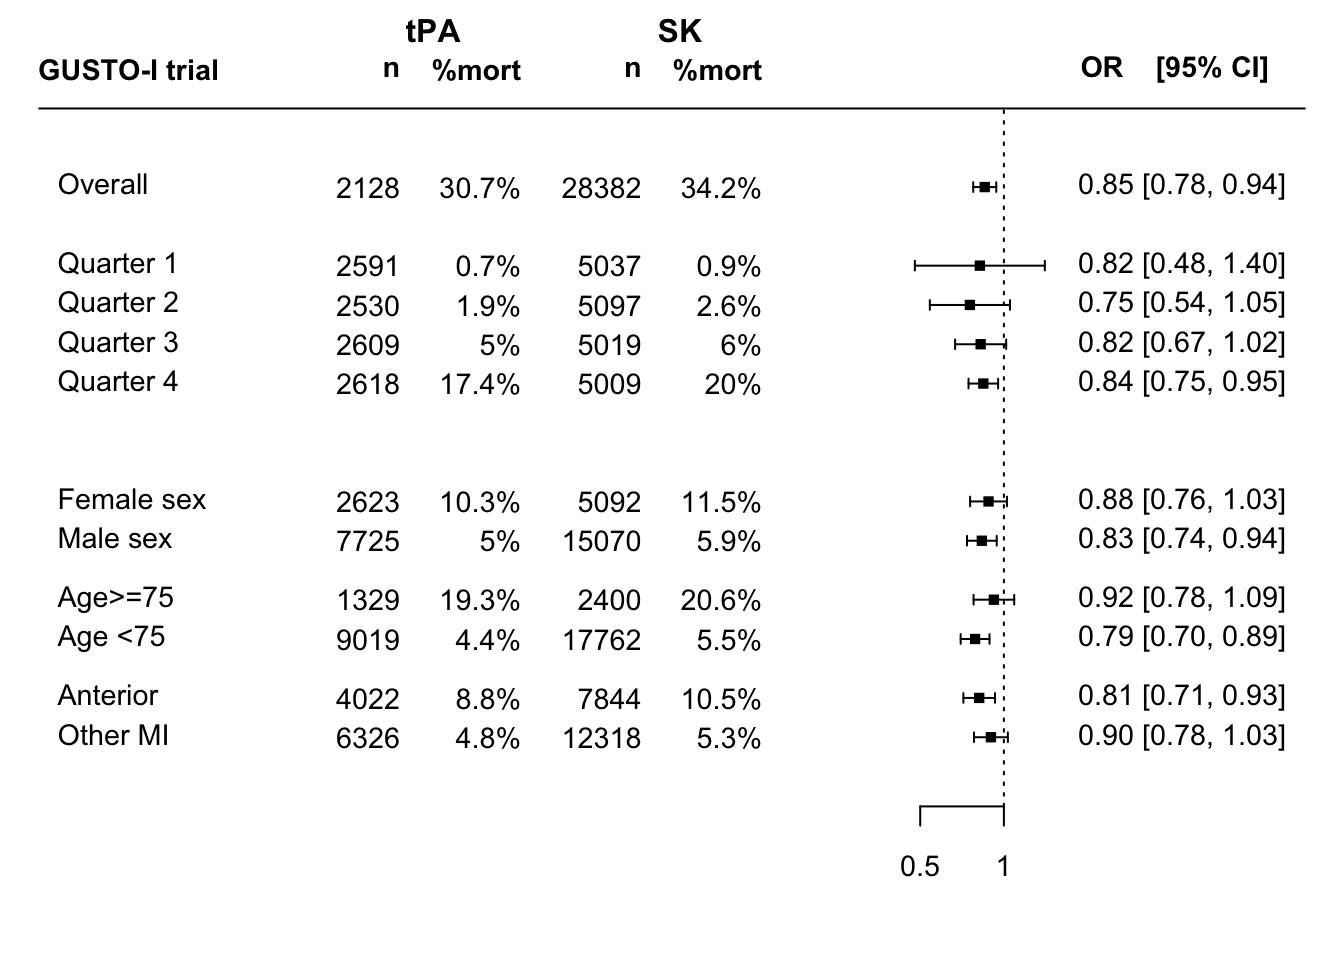
Let's expand the standard forest plot for subgroup effects with risk-based subgroups.
Below subgroup effects are defined for 4 risk-based groups using `cut2(lp.no.tx, g=4)`,
and for 3 classical subgroups (by sex, age, type of infarction).
```{r risk.subgroup.effects}
## quantiles, suggest to use quarters
groups <- cut2(lp.no.tx, g=4)
group0 <- groups[gusto$tpa==0]  # SK gropup
group1 <- groups[gusto$tpa==1]  # tPA group

rate0 <- prop.table(table(group0, gusto$day30[gusto$tpa==0]),1 )[,2]
rate1 <- prop.table(table(group1, gusto$day30[gusto$tpa==1]),1 )[,2]
ratediff <- rate0-rate1 # benefit of tPA by group

# Make a data frame for the results
data.subgroups <- as.data.frame(matrix(nrow=(4+6+1), ncol=10))
colnames(data.subgroups) <- c("tevent", "tnoevent", "cevent", "cnoevent",
                              "name", "type", "tn", "pt", "cn", "pc")

data.subgroups[11,1:4] <- table(gusto$tpa,gusto$day30)[4:1] # overall results
# define event and non-event numbers
events1   <- table(group0, gusto$day30[gusto$tpa==0])[,2]
nevents1  <- table(group0, gusto$day30[gusto$tpa==0])[,1]
events2   <- table(group1, gusto$day30[gusto$tpa==1])[,2]
nevents2  <- table(group1, gusto$day30[gusto$tpa==1])[,1]
n1      <- events1 + nevents1
n2      <- events2 + nevents2

data.subgroups[10:7,1:4] <- cbind(events2,nevents2,events1,nevents1)
```
Data for classic subgroups are managed below:
```{r classic.subgroup.effects}
# Use `table`  to get the summary of cell numbers, by subgroup
# SEX
data.subgroups[5,1:4] <- table(1-gusto$day30,1-gusto$tpa, gusto$sex)[1:4]
data.subgroups[6,1:4] <- table(1-gusto$day30,1-gusto$tpa, gusto$sex)[5:8]
# AGE
data.subgroups[3,1:4] <- table(1-gusto$day30,1-gusto$tpa, gusto$age>=75)[1:4]
data.subgroups[4,1:4] <- table(1-gusto$day30,1-gusto$tpa, gusto$age>=75)[5:8]
# ANT
data.subgroups[1,1:4] <- table(1-gusto$day30,1-gusto$tpa, gusto$miloc=="Anterior")[1:4]
data.subgroups[2,1:4] <- table(1-gusto$day30,1-gusto$tpa, gusto$miloc=="Anterior")[5:8]

# Names
data.subgroups[11,5]   <- "Overall"
data.subgroups[10:7,5] <- paste("Quarter",1:4, sep=" ")
data.subgroups[5:6,5]  <- c("Male sex","Female sex")
data.subgroups[3:4,5]  <- c("Age <75","Age>=75")
data.subgroups[1:2,5]  <- c("Other MI","Anterior")

# Type of subgroup
data.subgroups[11,6]   <- ""
data.subgroups[10:7,6] <- c(rep("Risk-based subgroups", length(ratediff)))
data.subgroups[1:6,6] <- c(rep("Location",2), rep("Age",2), rep("Sex",2))

data.subgroups[,7] <- data.subgroups[,1] + data.subgroups[,2]
data.subgroups[,8] <- paste(round(100*data.subgroups[,1] / data.subgroups[,7] , 1),"%", sep="")
data.subgroups[,9] <- data.subgroups[,3] + data.subgroups[,4]
data.subgroups[,10] <- paste(round(100*data.subgroups[,3] / data.subgroups[,9] , 1),"%", sep="")

# Show the data
kable(as.data.frame((data.subgroups))) %>% kable_styling(full_width=F, position = "left")
```
In this table **tevent** means #events among treated; **cevent** means #events among non-treated; etc
Results can be plotted with `metafor` functions:
```{r subgroup.effects}
par(mar=c(4,4,1,2))
### fit random-effects model (use slab argument to define "study" labels)
res <- rma(ai=tevent, bi=tnoevent, ci=cevent, di=cnoevent, data=data.subgroups, measure="OR",
           slab=name, method="ML")

### set up forest plot (with 2x2 table counts added); rows argument is used
### to specify exactly in which rows the outcomes will be plotted)
forest(res, xlim=c(-8, 2.5), at=log(c(0.5, 1)), alim=c(log(0.2), log(2)), atransf=exp,
       ilab=cbind(data.subgroups$tn, data.subgroups$pt, data.subgroups$cn, data.subgroups$pc),
       ilab.xpos=c(-5,-4,-3,-2), adj=1,
       cex=.9, ylim=c(0, 19),
       rows=c(1:2, (4:5)-.5, 6:7, 10:13, 15),
       xlab="", mlab="", psize=.8, addfit=F)
# lines(x=c(-.15, -.15), y=c(0, 17)) ## could add a reference line of the overall treatment effect

text(c(-5,-4,-3,-2, 2.2), 18, c("n", "%mort", "n", "%mort", "OR    [95% CI]"),
     font=2, adj=1, cex=.9)
text(-8, 18, c("GUSTO-I trial"), font=2, adj=0, cex=.9)
text(c(-4.5,-2.5),  19, c("tPA", "SK"), font=2, adj=1)
# This can be improved
```
This forest plot shows the unadjusted overall effect of tPA vs SK treatment; risk-based subgroup effects; and traditional one at a time subgroup effects. The latter are to be interpreted with much caution; many false-positive findings may arise.
::: {.quoteit}
Q: What R function can assist trialists in their reporting of risk-based subgroups together with classic subgroups?
:::
We can also estimate the same subgroup effects, adjusted for baseline risk.
```{r adjusted.subgroup.effects.function}
# function for adjustment
subgroup.adj <- function(data=gusto, subgroup=gusto$sex) {
  coef.unadj <- by(data, subgroup, function(x)lrm.fit(y=x$day30, x=x$tpa)$coef[2])
  var.unadj  <- by(data, subgroup, function(x)lrm.fit(y=x$day30, x=x$tpa)$var[2,2])
  coef.adj   <- by(data, subgroup, function(x)lrm.fit(y=x$day30, x=x$tpa, offset=x$lp)$coef[2])
  var.adj    <- by(data, subgroup, function(x)lrm.fit(y=x$day30, x=x$tpa, offset=x$lp)$var[2,2])
  result <- cbind(coef.unadj, coef.adj, coef.ratio=coef.adj/coef.unadj,
                  SEunadj=sqrt(var.unadj), SEadj=sqrt(var.adj),
                  SEratio=sqrt(var.adj)/ sqrt(var.unadj))
  result} # end function

options(digits=3)
```
Overall trial result (un)adjusted
```{r}
kable(as.data.frame(subgroup.adj(gusto, gusto$tpa>-1))) %>%
  kable_styling(full_width=F, position = "left")
```
Risk-based subgroups
```{r}
kable(as.data.frame(subgroup.adj(gusto, groups))) %>%
  kable_styling(full_width=F, position = "left")
```
Classic subgroup: men vs women
```{r}
kable(as.data.frame(subgroup.adj(gusto, gusto$sex))) %>%
  kable_styling(full_width=F, position = "left")
```
Classic subgroup: old (>=75) vs younger age
```{r}
kable(as.data.frame(subgroup.adj(gusto, gusto$age>=75))) %>%
  kable_styling(full_width=F, position = "left")
```
The unadjusted and adjusted results are usually quite in line; only subtle differences is the estimates of the relative effects are noted. We might hypothesize that the unadjusted effect for women is confounded by the higher age of women (where higher age was associated with a somewhat weaker treatment effect); this was not confirmed.
::: {.quoteit}
Q: What R function can be developed that extends the unadjusted forest plots to provide subgroup effects, adjusted for baseline characteristics?
:::
### 1b. Absolute benefit of treatment by risk-group
```{r grouping}
# 95% CI
CI      <- BinomDiffCI(x1 = events1, n1 = n1, x2 = events2, n2 = n2, method = "scorecc")

colnames(CI) <- c("Absolute difference", "Lower CI", "Upper CI")
rownames(CI) <- names(events1)

result <- round(CI, 3) # absolute difference with confidence interval
kable(as.data.frame(result)) %>% kable_styling(full_width=F, position = "left")
```
So, we see a substantial difference in absolute benefit. Low risk according to the linear predictor (lp<-2.36) implies low benefit (<1%); higher risk, higher benefit (>2%). As **Frank Harrell** would also emphasize, the grouping in quarters might primarily be considered for illustration. A better estimation of benefit avoids grouping, and conditions on the baseline risk.
### 2a. Relative effects of treatment by baseline risk
The checks for interaction with the linear predictor were far from statistically significant in GUSTO-I, as shown above; supporting the assumption that 1 single adjusted, relative effect applies across baseline risk.
### 2b. Absolute benefit of treatment by baseline risk
Estimation of absolute benefit can follow a parametric approach, i.e. following the no interaction, main effect model that includes baseline characteristics and a treatment effect; the model `f` considered above for the primary analysis of the trial.
Further down we will consider relaxations of the proportionality of effect that is assumed in this model.
```{r plot.benefit}
# create baseline predictions: X-axis
xp <- seq(0.002,.5,by=0.001)
logxp0 <- log(xp/(1-xp))

# expected difference, if covariate adjusted model holds
p1exp <- plogis(logxp0) - plogis(logxp0+coef(f)[2]) # proportional effect assumed

plot(x=xp, y=p1exp, type='l', lty=2, lwd=3, xlim=c(0,.35), ylim=c(-0.007,.05), col="red",
     xlab="Baseline risk", ylab="Benefit by tPA", cex.lab=1.2, las=1, bty='l' )
# add horizontal line
lines(x=c(0,.5), y=c(0,0))
# distribution of predicted
histSpike(plogis(lp.no.tx), add=T, side=1, nint=300, frac=.15)

points(x=rate0, y=ratediff, pch=1, cex=2, lwd=2, col="blue")
arrows(x0=rate0, x1=rate0, y0=CI[,2], y1=CI[,3], angle=90, code=3,len=.1, col="blue")

legend("topleft", lty=c(2,NA), pch=c(NA,1), lwd=c(3,2), bty='n',col=c("red", "blue"), cex=1.2,
       legend=c("Expected with proportional effect",
                "Grouped patients"))
```
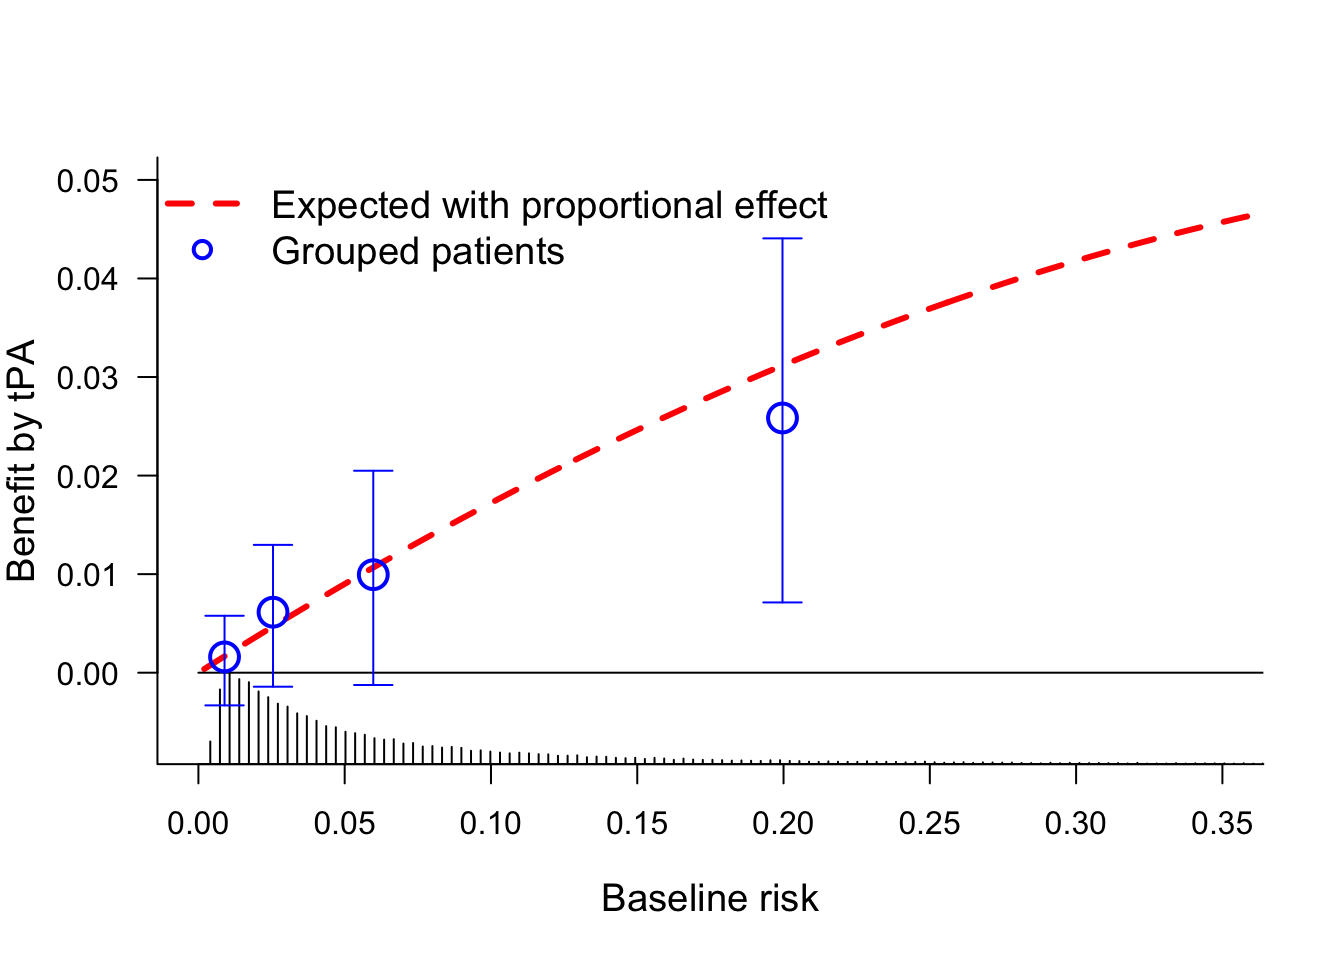
This plot shows the benefit by tPA treatment over SK. The red line assumes a proportional effect of treatment, which may be quite reasonable here and in many other diseases. The quarters provide for a non-parametric confirmation of the benefit across baseline risk.
### Relaxation of the proportional effect assumption
If we want to relax the proportional effect assumption, the blog by **Frank Harrell** on **_[examining HTE](../varyor/)_** provides an illustration with **penalized logistic regression**.
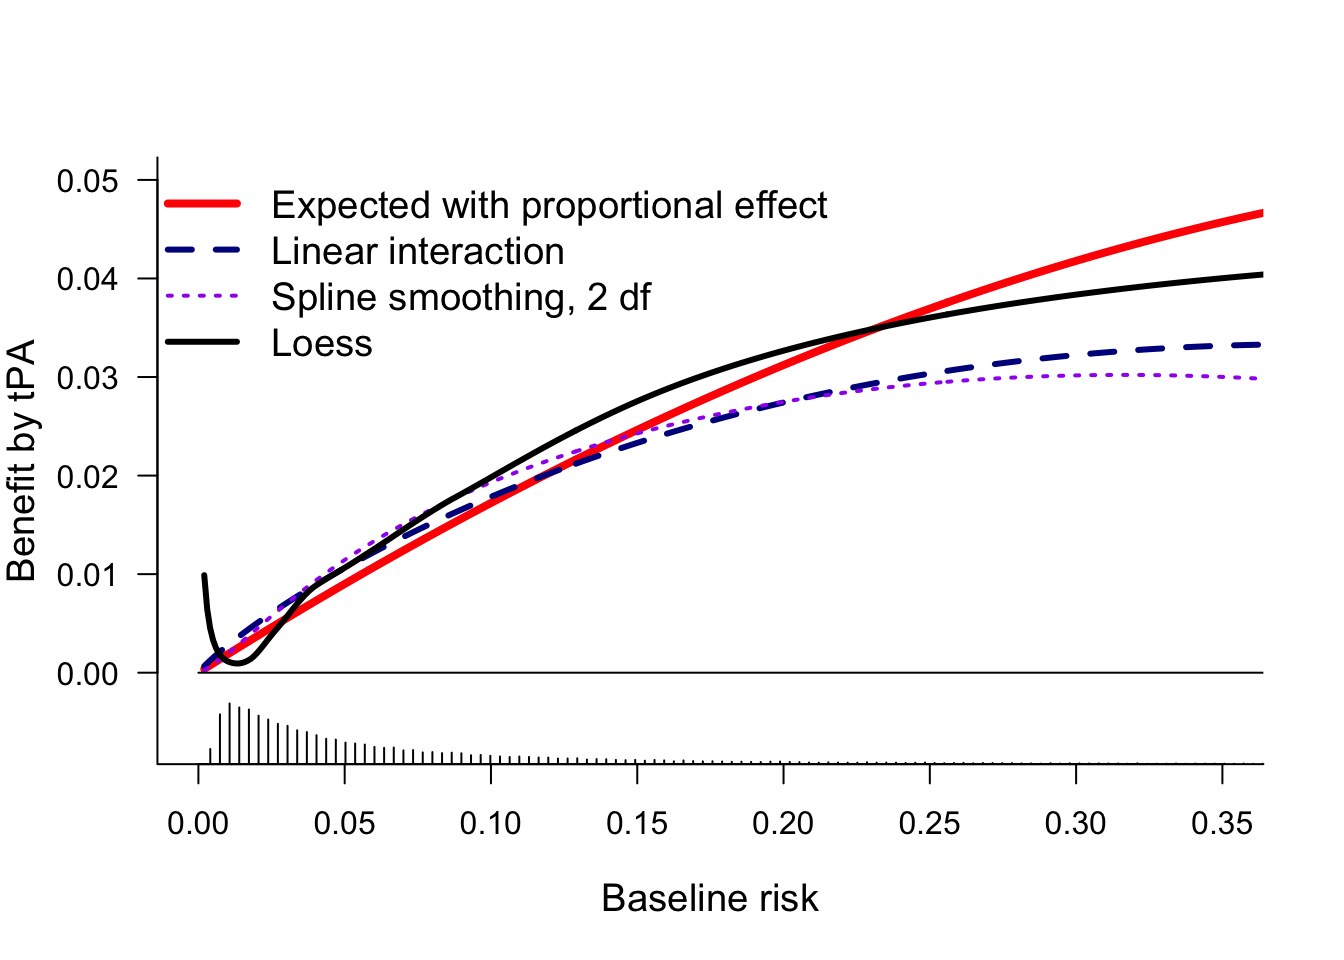
Another possible relaxation is by including **interaction with the linear predictor**. We consider linear interaction and a non-linear interaction (`rcs`, 2 *df* for non-linearity).
And we could try a more non-paramteric approach as in [Califf 1997](https://www.sciencedirect.com/science/article/pii/S0002870397701649). There, `loess` smoothers were used for risk estimation the tPA (`day30~lp, subset=tpa==1`) and SK groups (`day30~lp, subset=tpa==0`).
Benefit was the differences between these 2 risk groups conditional on baseline risk.
```{r interaction.with.lp}
h  <- lrm(day30 ~ tpa + tpa * lp, data=gusto, eps=0.005, maxit=30)
h2 <- lrm(day30 ~ tpa + rcs(lp,3)*tpa, data=gusto, eps=0.005, maxit=99)
# loess smoothing
l0 <- loess(day30 ~ lp, data=gusto, subset=tpa==0)
l1 <- loess(day30 ~ lp, data=gusto, subset=tpa==1)

# subtract predicted risks with from without tx
p1 <- plogis(Predict(h,  tpa=0, lp = logxp0)[,3]) -
      plogis(Predict(h,  tpa=1, lp = logxp0)[,3])
p2 <- plogis(Predict(h2, tpa=0, lp = logxp0)[,3]) -
      plogis(Predict(h2, tpa=1, lp = logxp0)[,3])
l  <- predict(l0, data.frame(lp = logxp0)) -
      predict(l1, data.frame(lp = logxp0))

plot(x=xp, y=p1exp, type='l', lty=1, lwd=4, xlim=c(0,.35), ylim=c(-0.007,.05), col="red",
     xlab="Baseline risk", ylab="Benefit by tPA", cex.lab=1.2, las=1, bty='l' )
# benefit with interaction terms
lines(x=xp, y=p1, type='l', lty=2, lwd=3, col="dark blue")
lines(x=xp, y=p2, type='l', lty=3, lwd=2, col="purple")
lines(x=xp, y=l,  type='l', lty=1, lwd=3, col="black")

# horizontal line
lines(x=c(0,.5), y=c(0,0))
# distribution of predicted
histSpike(plogis(lp.no.tx), add=T, side=1, nint=300, frac=.1)

legend("topleft", lty=c(1,2,3,1), pch=c(NA,NA,NA,NA), lwd=c(4,3,2,3), bty='n',
       col=c("red", "dark blue", "purple","black"), cex=1.2,
       legend=c("Expected with proportional effect",
                "Linear interaction", "Spline smoothing, 2 df",
                "Loess"))
```
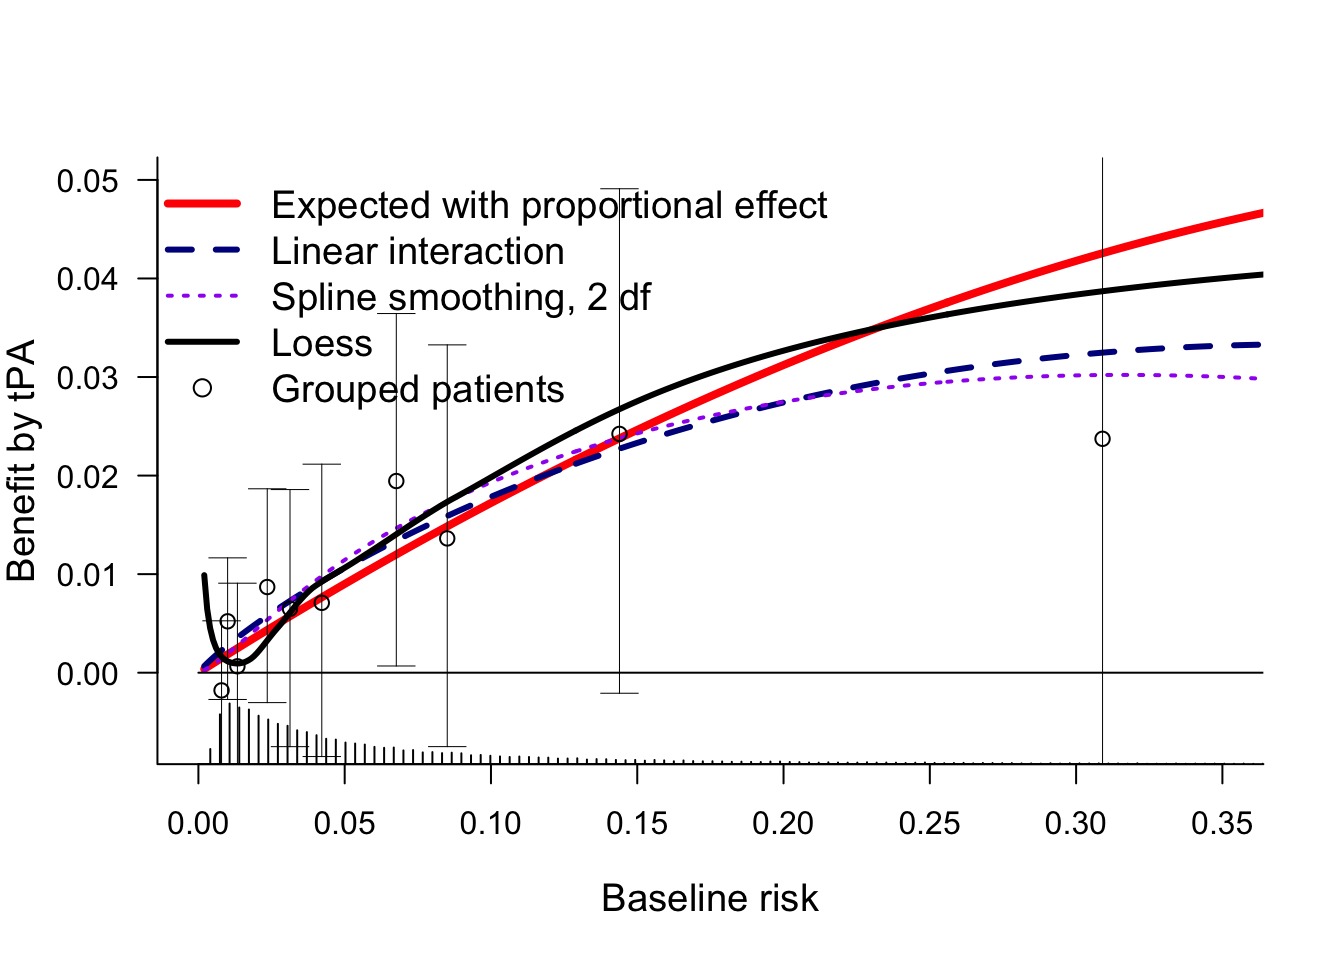
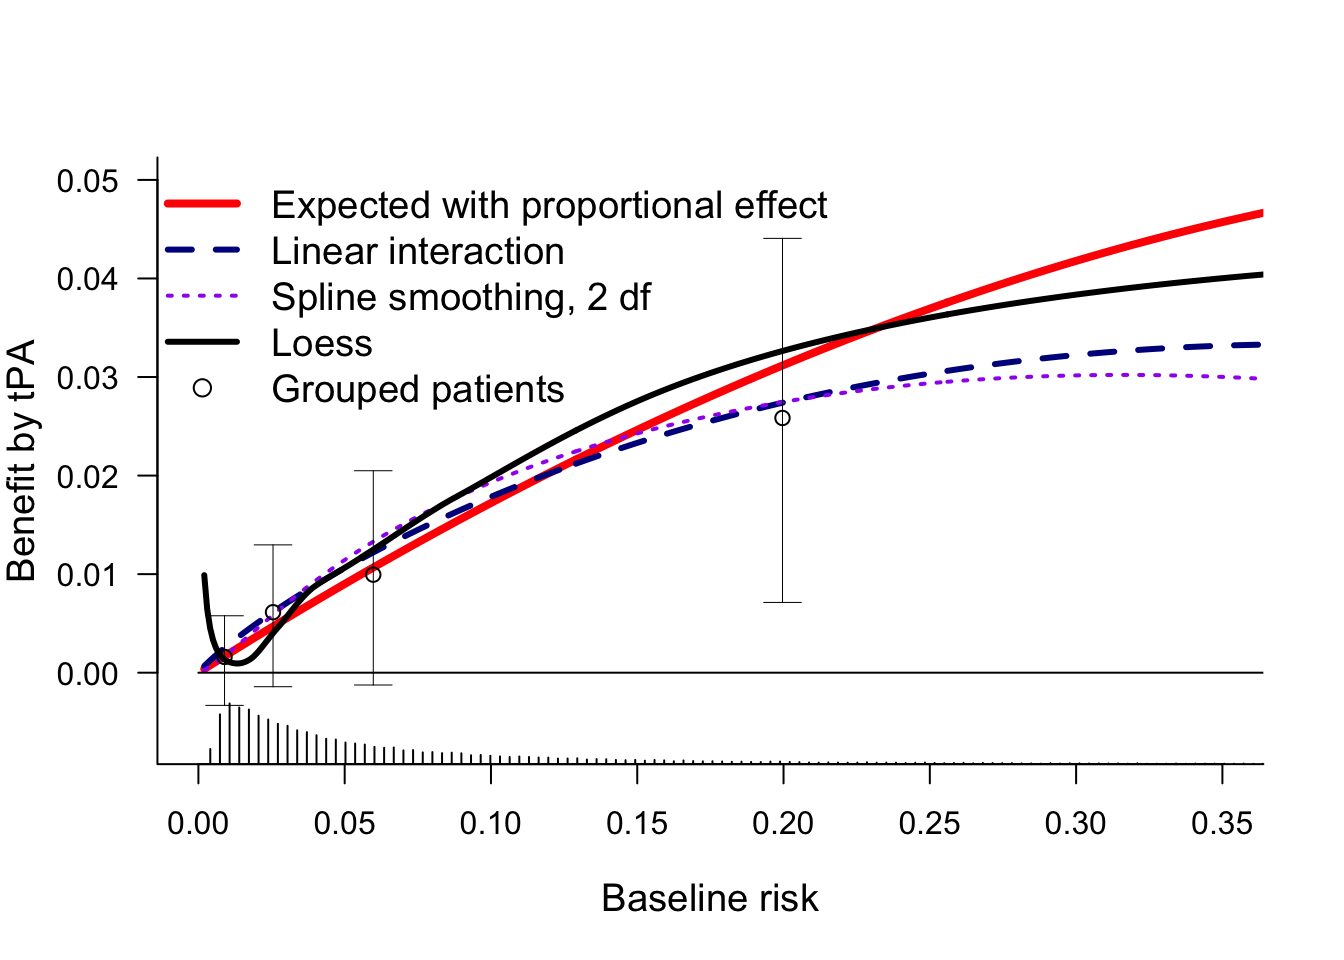
This plot confirms that all estimates of benefit by baseline risk are more or less similar, with benefit clearly increasing by baseline risk. For very low baseline risk, the `loess` estimates are implausible.
We can also add the grouped observations by decile, as in [Califf 1997](https://www.sciencedirect.com/science/article/pii/S0002870397701649). The 95% confidence intervals show that the uncertainty per risk group is huge.
::: {.quoteit}
Q: How many risk-based groups should be used for illustration of benefit by risk? Default: use quartiles to define 4 quarters; perhaps 3 or only 2 groups in smaller trials?
:::
```{r interaction.with.lp.deciles}
g <- 10 # first deciles
h  <- lrm(day30 ~ tpa + tpa * lp, data=gusto, eps=0.005, maxit=30)
h2 <- lrm(day30 ~ tpa + rcs(lp,3)*tpa, data=gusto, eps=0.005, maxit=99)
# loess smoothing
l0 <- loess(day30 ~ lp, data=gusto, subset=tpa==0)
l1 <- loess(day30 ~ lp, data=gusto, subset=tpa==1)

# subtract predicted risks with from without tx
p1 <- plogis(Predict(h,  tpa=0, lp = logxp0)[,3]) -
      plogis(Predict(h,  tpa=1, lp = logxp0)[,3])
p2 <- plogis(Predict(h2, tpa=0, lp = logxp0)[,3]) -
      plogis(Predict(h2, tpa=1, lp = logxp0)[,3])
l  <- predict(l0, data.frame(lp = logxp0)) -
      predict(l1, data.frame(lp = logxp0))

plot(x=xp, y=p1exp, type='l', lty=1, lwd=4, xlim=c(0,.35), ylim=c(-0.007,.05), col="red",
     xlab="Baseline risk", ylab="Benefit by tPA", cex.lab=1.2, las=1, bty='l' )
# benefit with interaction terms
lines(x=xp, y=p1, type='l', lty=2, lwd=3, col="dark blue")
lines(x=xp, y=p2, type='l', lty=3, lwd=2, col="purple")
lines(x=xp, y=l,  type='l', lty=1, lwd=3, col="black")

# horizontal line
lines(x=c(0,.5), y=c(0,0))
# distribution of predicted
histSpike(plogis(lp.no.tx), add=T, side=1, nint=300, frac=.1)

# risk groups
groups <- cut2(lp.no.tx, g=g)
group0 <- groups[gusto$tpa==0]  # SK gropup
group1 <- groups[gusto$tpa==1]  # tPA group

rate0 <- prop.table(table(group0, gusto$day30[gusto$tpa==0]),1 )[,2]
rate1 <- prop.table(table(group1, gusto$day30[gusto$tpa==1]),1 )[,2]
ratediff <- rate0-rate1 # benefit of tPA by group

# CI re-calculation
events1   <- table(group0, gusto$day30[gusto$tpa==0])[,2]
nevents1  <- table(group0, gusto$day30[gusto$tpa==0])[,1]
events2   <- table(group1, gusto$day30[gusto$tpa==1])[,2]
nevents2  <- table(group1, gusto$day30[gusto$tpa==1])[,1]
n1      <- events1 + nevents1
n2      <- events2 + nevents2
CI      <- BinomDiffCI(x1 = events1, n1 = n1, x2 = events2, n2 = n2, method = "scorecc")

points(x=rate0, y=ratediff, pch=1, cex=1, lwd=1, col="black")
arrows(x0=rate0, x1=rate0, y0=CI[,2], y1=CI[,3], angle=90, code=3,len=.1, col="black", lwd=.5)

legend("topleft", lty=c(1,2,3,1,NA), pch=c(NA,NA,NA,NA,1), lwd=c(4,3,2,3,1), bty='n',
       col=c("red", "dark blue", "purple","black","black"), cex=1.2,
       legend=c("Expected with proportional effect",
                "Linear interaction", "Spline smoothing, 2 df",
                "Loess",
                "Grouped patients"))
```
```{r interaction.with.lp.quarters}
g <- 4 # quarters

plot(x=xp, y=p1exp, type='l', lty=1, lwd=4, xlim=c(0,.35), ylim=c(-0.007,.05), col="red",
     xlab="Baseline risk", ylab="Benefit by tPA", cex.lab=1.2, las=1, bty='l' )
# benefit with interaction terms
lines(x=xp, y=p1, type='l', lty=2, lwd=3, col="dark blue")
lines(x=xp, y=p2, type='l', lty=3, lwd=2, col="purple")
lines(x=xp, y=l,  type='l', lty=1, lwd=3, col="black")

# horizontal line
lines(x=c(0,.5), y=c(0,0))
# distribution of predicted
histSpike(plogis(lp.no.tx), add=T, side=1, nint=300, frac=.1)

# risk groups
groups <- cut2(lp.no.tx, g=g)
group0 <- groups[gusto$tpa==0]  # SK gropup
group1 <- groups[gusto$tpa==1]  # tPA group

rate0 <- prop.table(table(group0, gusto$day30[gusto$tpa==0]),1 )[,2]
rate1 <- prop.table(table(group1, gusto$day30[gusto$tpa==1]),1 )[,2]
ratediff <- rate0-rate1 # benefit of tPA by group

# CI re-calculation
events1   <- table(group0, gusto$day30[gusto$tpa==0])[,2]
nevents1  <- table(group0, gusto$day30[gusto$tpa==0])[,1]
events2   <- table(group1, gusto$day30[gusto$tpa==1])[,2]
nevents2  <- table(group1, gusto$day30[gusto$tpa==1])[,1]
n1      <- events1 + nevents1
n2      <- events2 + nevents2
CI      <- BinomDiffCI(x1 = events1, n1 = n1, x2 = events2, n2 = n2, method = "scorecc")

points(x=rate0, y=ratediff, pch=1, cex=1, lwd=1, col="black")
arrows(x0=rate0, x1=rate0, y0=CI[,2], y1=CI[,3], angle=90, code=3,len=.1, col="black", lwd=.5)

legend("topleft", lty=c(1,2,3,1,NA), pch=c(NA,NA,NA,NA,1), lwd=c(4,3,2,3,1), bty='n',
       col=c("red", "dark blue", "purple","black","black"), cex=1.2,
       legend=c("Expected with proportional effect",
                "Linear interaction", "Spline smoothing, 2 df",
                "Loess",
                "Grouped patients"))
```
## Conclusions
The GUSTO-I trial serves well to illustrate the impact of conditioning on baseline covariates when we consider relative and absolute effects of treatment on binary outcomes. The risk-adjusted estimate of the overall treatment effect has a different interpretation than the unadjusted estimate: the effect for *‘Patients with acute MI’* versus *‘A patient with a certain risk profile’*.
### Implications for reporting of RCTs
RCTs typically report on:
1. an overall effect in the primary analysis;
this analysis should condition on baseline covariates as argued in another blog.
2. effects stratified by single characteristics: one at a time subgroup analyses;
these analyses should be regarded as secondary and exploratory.
Future RCT reports should include:
1. an adjusted estimate of the overall treatment effect as the primary analysis;
2. effects stratified by baseline risk;
typically in 4 risk-based subgroups for illustration,
and in an analysis with continuous baseline risk, typically plotted as benefit by baseline risk.
3. traditional subgroup analyses only as secondary and exploratory information; not to influence decision-making based on the current RCT, but to inform future studies and new RCTs. An exception may be the situation that strong prior hypotheses exist on effect modeification on the relative scale, as discussed in the [ICEMAN report](https://macsphere.mcmaster.ca/handle/11375/24375).
### References
#### GUSTO-I references
Gusto Investigators - New England Journal of Medicine, 1993
[An international randomized trial comparing four thrombolytic strategies for acute myocardial infarction](https://www.nejm.org/doi/full/10.1056/NEJM199309023291001)
Califf R, …, ML Simoons, EJ Topol, GUSTO-I Investigators - American heart journal, 1997
[Selection of thrombolytic therapy for individual patients: development of a clinical model](https://www.sciencedirect.com/science/article/pii/S0002870397701649)
EW Steyerberg, PMM Bossuyt, KL Lee - American heart journal, 2000
[Clinical trials in acute myocardial infarction: should we adjust for baseline characteristics?](https://www.sciencedirect.com/science/article/pii/S0002870300900012)
#### PATH Statement references
**The Predictive Approaches to Treatment effect Heterogeneity
(PATH) Statement**<br>
David M. Kent, MD, MS; Jessica K. Paulus, ScD; David van Klaveren, PhD; Ralph D’Agostino, PhD;
Steve Goodman, MD, MHS, PhD; Rodney Hayward, MD; John P.A. Ioannidis, MD, DSc; Bray Patrick-Lake, MFS; Sally Morton, PhD;
Michael Pencina, PhD; Gowri Raman, MBBS, MS; Joseph S. Ross, MD, MHS; Harry P. Selker, MD, MSPH; Ravi Varadhan, PhD;
Andrew Vickers, PhD; John B. Wong, MD; and Ewout W. Steyerberg, PhD
*Ann Intern Med. 2020;172:35-45.*
[Annals of Internal Medicine, main text](https://annals.org/acp/content_public/journal/aim/938321/aime202001070-m183667.pdf?casa_token=rjMhlqehmZYAAAAA:s2gnJxSo---fGeU5d3BYBJ0s3S8UMxMWhH7RQXNlK8WmHH7WvghrEZJODK1fI_8KsvW1bPavUew)
[Annals of Internal Medicine, Explanation and Elaboration](https://annals.org/acp/content_public/journal/aim/938321/aime202001070-m183668.pdf?casa_token=HSOwDdYuIfUAAAAA:LprkkDo9-n-qcHqcOC5IHsDWQtjd3CO_SXrSdF0SimqTuIG5I6rKEwhT24ySEZwxTr7GLpn56vM)
[Editorial by Localio et al, 2020](https://annals.org/aim/fullarticle/2755584/advancing-personalized-medicine-through-prediction)
#### Risks of traditional subgroup analyses
SF Assmann, SJ Pocock, LE Enos, LE Kasten - The Lancet, 2000 [Subgroup analysis and other (mis) uses of baseline data in clinical trials](https://www.sciencedirect.com/science/article/pii/S0140673600020390)
PM Rothwell - The Lancet, 2005 [Subgroup analysis in randomised controlled trials: importance, indications, and interpretation](https://www.sciencedirect.com/science/article/pii/S0140673605177095)
RA Hayward, DM Kent, S Vijan… - BMC medical research nmethodology, 2006 [Multivariable risk prediction can greatly enhance the statistical power of clinical trial subgroup analysis](https://bmcmedresmethodol.biomedcentral.com/articles/10.1186/1471-2288-6-18)
AV Hernández, E Boersma, GD Murray… - American heart journal, 2006 [Subgroup analyses in therapeutic cardiovascular clinical trials: are most of them misleading?](https://www.sciencedirect.com/science/article/pii/S0002870305004394)
JD Wallach, …, KL Sainani, EW Steyerberg, JPA Ioannidis - JAMA internal medicine, 2017 [Evaluation of evidence of statistical support and corroboration of subgroup claims in randomized clinical trials](https://jamanetwork.com/journals/jamainternalmedicine/article-abstract/2601419)
JD Wallach, …, JF Trepanowski, EW Steyerberg, JPA Ioannidis - BMJ, 2016 [Sex based subgroup differences in randomized controlled trials: empirical evidence from Cochrane meta-analyses](https://www.bmj.com/content/355/bmj.i5826)